In my last blog, I went back to basics and discussed Domestic Accounting in perspective. We saw how domestic financial activity continues on a day-to-day basis in any domestic situation regardless or not of whether accounting is undertaken. Now it is time to start thinking about how we can capture and make use of information about that activity, through modelling it by the use of accounting.
The alternatives are to capture it on a one-time basis, perhaps to help make some financial decision that is looming, such as house purchase. Alternatively, we can make a proper job of it and start accounting for it on a full-time, continuous basis. The advantages of this are that the overheads can be tackled just once and that you will then be in a position to really start to plan and control all your financial activity and hence your lifestyle, on a continuing basis throughout your lifetime.
The way I will approach the subject is to start with reports. If you think about it, the whole purpose of accounting is to obtain information that will enable us to achieve our objective – successful management and control of our personal finances.
Accounting has five main activities shown in logical sequence, below:
the setting up of an accounting system with the necessary individual accounts and reports – a one-time exercise
bookkeeping, being the periodic entering of basic financial activity data as transactions, into the appropriate accounts
the production of summarised information from the accumulated transactions in the form of reports and associated charts, whenever needed
the analysis and decision making to influence future financial activity in order to improve the financial situation
setting up, monitoring and adjusting future financial activity as needed, through budgeting, discipline and monitoring, in order to start achieving the desired results in the subsequent periods
You will notice that the creation of reports and charts is at the end of the three production activities. These reports are used as the starting point for the last two activities, analysis and decision-making followed by the execution stage, to start to achieve the desired results in the next accounting period.
I mentioned that DWB Accounting is introduced as a model which can be implemented on off-the-shelf software accounting packages run on a PC. Consequently, there will be differences in detail about how certain activities are accomplished depending on the architectural and implementation details of each particular software package.
However, the basic concepts in terms of the information collected and the reports obtained and the analysis and decision making should be identical, as called for by the new domestic accounting model.
We can consider reports from two perspectives. First, the raw data as produced by the individual software packages and second, tidied up or formatted reports based on the content of the raw data reports. I say raw data because this will be in the style and format of the data obtained from a software package in its own query and reporting tools.
Although it will mostly be very usable as it is produced by the appropriate queries and presentation programs of the accounting software, we sometimes need prettier and better formatted versions of some of the reports to assist our analysis (and perhaps for any printed records we may choose to keep). We can do this easily by transferring the raw report data to a spreadsheet program such as Microsoft Excel© or Open Office Calc© (free but contribution invited) for further editing.
The software packages often have on-screen interfaces for their displayed reports whereby using mouse-clicks; more detail can quickly and easily be obtained by ‘drilling down’. Printed reports whether formatted or not, obviously lose this dynamic capability to quickly hone in on more detail but we can always retain as many different versions of the reported detail of the data as we wish in printed format.
We always want to make things as easy as possible for ourselves so most of the queries, reports and spreadsheet programs will be saved as prototypes or ‘pre-stored‘ queries for repeated, future use.
The sort of accounting we should do is designed to run continuously, year after year. This is a feature of double entry accounting which business uses and that I have adapted for home use.
Time is divided up into periods where the main period is usually a year, with smaller sub-divisions as needed, such as three-monthly, quarters and individual months. Most of our report programs will be used repeatedly for each of the different time periods with changes made via parameters, to the beginning and end dates as required. This does not mean to say that a report cannot be run at any time during the current period as needed, just to peek at some aspect of the current situation or look back on previous situations.
There are two fundamental reports that the new accounting model defines with some optional extra reports for those who wish to go into more detail.
In accounting, we always talk about our financial situation as at some particular instant of time – usually the end of a period such as the last day of a particular month, quarter or year. This sort of report provides our so-called, Domestic Wealth which represents our total value, or what we are worth on that day. We can obtain the value for our Domestic Wealth if we total up the values of all our assets and subtract from this total, what we owe to others which are our liabilities or personal debts. This report is called a Domestic Balance Sheet (DBS) and is quite similar in concept to a business Balance Sheet - for those knowing something about business accounting.
As time progresses during some period, we will receive increases in our Domestic Wealth from wages or salary, proceeds from the sale of a car perhaps and maybe windfalls from investments, as an inheritance, or even prize winnings. Similarly we will see reductions in this value as decreases, as a result of payments for food, utilities, health, hobbies and holidays, perhaps the purchase of a replacement car and maybe, as a result of depreciation on the value of our home.
Another type of report is used to capture all the details of these financial changes over some period and it is called a Domestic Well-Being Statement (DWBS). It is the most useful of the reports as it is the main source for the analysis leading to decisions we may need to make in order to achieve some improvements in our situation. The analogy with business accounting here is that the DWBS is most equivalent to the Trading Statement and Profit & Loss account.
The information captured in the accounts during some period and used in order to give us a DWBS also needs to be modified in some way at the end of each period in order to give us a new, up-to-date DBS showing our latest Domestic Wealth. This new Domestic Wealth will always be derived from the latest total values of our assets less our liabilities; these will have taken into account (there’s an appropriate phrase!) all the changes - those increases and decreases - occurring during the period since our last DBS.
In a later blog I will talk a little bit about the theory behind domestic accounting and introduce you to what I call the domestic accounting equation. This will make it easy to understand the relationship between these key ideas of Assets, Liabilities, Domestic Change and Domestic Wealth, together with a new way to associate these concepts with all the individual accounts we will need to keep and the various transactions corresponding to our on-going, domestic financial activity.
It is time now to look at some reports so first of all here are formatted versions of the DBS and DWBS covering a whole year, together with the previous year’s figures alongside for comparison. Note that figures in parentheses in red represent negative values.
These formatted reports will be followed by some examples of the corresponding raw reports from two different software packages, Personal Accountz© and Microsoft Money©:

I should explain that the accounts used in these examples are from the book ‘Accounting for a Better Life’ where I used a sample set of accounts covering the financial activity of a family over a whole year – 6 April 2004 to 5 April 2005. The book was based on the use of Microsoft Money© but as already said, I have since started using a second package, Personal Accountz©, as an example and comparison of the use of a slightly different software package accounting architecture on which to implement the new DWB accounting model.
The DBS simply derives the Domestic Wealth based on a structured list of the assets less the liabilities or debts, held in the accounts on a specified day. This version of the DBS breaks down all these assets and liabilities into appropriate categories, together with some explanatory notes.
You will notice that the structure of the report distinguishes between the assets and the liabilities and also, that the assets and the liabilities are separately categorised into successively greater levels of detail. This is an issue of convenience and if the detail is of little interest, it can simply be omitted; a useful option is to create both summary and detailed versions of the DBS.
Looking at the Assets Section, you can see that the first distinction or split is into Fixed, Investment and Current assets. You will see later that we will have separate accounts or ‘containers’ for all these different categories of wealth and by using account name prefixes, we can associate any account with its purpose AF, AI or AC for Fixed Assets, Investment Assets or Current Assets, respectively. Current Assets represent all our quantities of cash which are usually held in different types of current or savings accounts in one or more banks.
In the Liabilities Section, the breakdown is simply into Long-term Liabilities and Current Liabilities. Long-term is for mortgages and loans whilst the Current Liabilities are for credit card or store-card accounts, for example. We will have similar account name prefixes for the liabilities of LL and LC for Long-term and Current Liabilities, respectively.
At the bottom of the DBS report, you can see the derivation of Net Worth or Domestic Wealth, being the difference between the totals of the assets and the liabilities. For the end of the current year, the value for Domestic Wealth is £514,200. It is interesting to notice that by showing the previous year’s value, we can see that the difference between the Domestic Wealth at the end of the previous year (£488,300) and the end of the current year is £25,900.
This value represents the result of all the increases and decreases that have occurred during this year-long period. It is called the Total Domestic Change (TDC) and if it is positive, it is called a Domestic Surplus or ‘Domplus’ and if the decreases exceed the increases, we have a Domestic Deficit or ‘Domicit’. By analogy, these are equivalent to the business concepts of net profit or loss.
The interesting thing will be to see how the TDC is made up, in terms of the different categories and sub-categories of increases and decreases that have taken place over a period. The reason for this again, is because it will have a major influence on how we might be able to change our financial activity in the future, if we discover that the financial aims and priorities for our household are not currently being met.
The two main uses of the DBS are to track the value of Domestic Wealth over the years and to be reminded of the distribution of our assets and liabilities for whenever it might be appropriate to change that distribution in some way.
In contrast to business where the focus is on maximising capital - owner's or shareholder's value - we would wish to see a steadily increasing value in domestic wealth to account for both normal inflation and our expectations in terms of an increase in general well-being as we progress through life.
Most people would like to progress through life with promotions at work or other advancements so that their living standards might steadily improve. With this, they might be able to perhaps provide more for their children in terms of education and opportunities than they experienced and that they might be able to afford more spacious homes for themselves and their expanding families during their lifetime.
The Domestic Well-Being Statement in contrast is the report that exposed the increases and decreases as change over any period and we would expect to find that its value is equal to that derived from comparing the Domestic Wealth at the beginning and the end of the same period in the DBS.
This version of the DWBS below, with full detail, is illustrated in three parts making up a single, continuous report. As before, this version shows values for both the previous and current periods, of the financial year 2004/05.


In this formatted version of the DWBS, explanatory headings have been added to make it easier to find our way around and to know what section we are looking at; you will also notice that much use is made of abbreviations (e.g. Basic Domestic Decreases – BDD) for the various category and subcategory totals and sub-totals. We will not make use of these abbreviations in these introductory articles but they do help full-time users to simplify relatively long phrases, particularly with the new Domestic Financial Factors that I will discuss in a later blog.
The DWBS displays all the increases and decreases occurring over a period. The important thing to notice is that the results are presented in a hierarchical structure which is in fact, the Domestic Well-Being structure.
This structure which covers both increases and decreases has three main, top-level categories – Basic, Discretionary and Others (non-Discretionary). Beneath each of these top-levels there are a series of lower-level categories which are different for increases and decreases and which continue down the hierarchy into successively lower and more detailed levels, ending if we went far enough, with the individual financial transactions themselves. These individual transactions are not shown in the reports of course but can easily be exposed on the screen to assist in the decision-making activities when needed.
It will take a little time initially to get used to the layout but as you study the ordered structure you will begin to see and be able to find important information. As an example, for the decreases, out of the total domestic decreases of £83,200 the amounts for the Basic, Discretionary and Other decreases were £43,500, £11,500 and £2,300 respectively.
Delving into the next lower level we can discover that the sub-totals for Essentials, Responsibilities and Family circumstances as proportions of the Basic total of £43,500 were £23,800 £18,900 and £600 respectively; and we can go on down the hierarchy to expand increasing detail in terms of further sub-categories.
Similarly, Essentials expands into Utilities, Food and Drink, Clothing, Health and Transport; whilst Responsibilities includes Income Tax, Council Tax, Mortgage Repayments, Home Maintenance, Household, Insurance, Professional Contributions, Garden and Miscellaneous; and Family Circumstances here, only has Presents. Similar patterns exist for the Discretionary Category and the Others (non-Discretionary) category.
Understandably, the individual figures do not mean much is isolation but when examined for balance and compared with previous values, much useful information begins to emerge. When I say balance, I mean the balance across the categories; that reasonable proportions of our increases are being spent equitably on the Basics, the Discretionary and Others.
In contrast to business where accounting exposes for the changes, the contributors to profits (sales and discount received) and losses (cost of stock, advertising, transportation, etc.) so that profit cam be maximised for the owner's benefit, the focus of the new accounting model on Domestic Well-Being ensures that the stored data and the associated reports are structured in a way that exposes the elements that can assist in maximising DWB.
In a household we do not wish to increase Domestic Wealth at all costs. We want to find a way to deliberately spend money on the appropriate items that will give us the best possible life in relation to the income at our disposal, as well as hopefully providing us with an ever-improving standard of living and overall wealth.
For example, if there are insufficient increases to cover the Basics then there is a potentially very serious problem and no form of accounting is likely to be of any help. Next,that within each of these top-level categories, there is a reasonable balance across each of the next lower level categories and that none of them is being unacceptably ignored or given inappropriate, too much/high or too little/low attention.
Domestic Well-Being is all about providing sufficient for the Basics and the Responsibilities but also trying to ensure that the Discretionaries, particularly the Nice-to-Haves, such as hobbies, holidays, lunches and dinners out, entertainment and so on are provided-for, in appropriate measure. It is all about the right balance - a little bit of everything, without excesses and also taking care of the short-term (the replacement car, the next holiday, a bigger house) and the long-term future (retirement).
The key to achieving all of this is the visibility that DWB accounting provides on all of the elements, on which decreases as expenses are expected, as well as all the increases and the background layer of the different types of assets and liabilities.
In a later blog I will discuss implementation issues and in particular, highlight the differences in approach of using a categorisation architecture as used in Microsoft Money© versus a so-called nominal accounts approach more typical of business accounting, as adopted in Personal Accountz©.
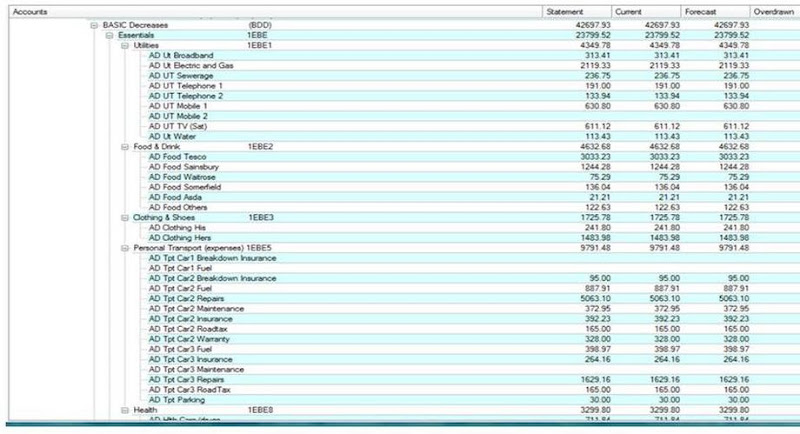
The next series of examples are of screen shots of raw data reports from Personal Accountz© where some of these differences will be discernible.

Although it will require further explanation once the idea of individual accounts has been accepted, this first report actually shows the values contained in both the DBS, as well as the DWBS. Most of the sub-categories have not been expanded in this first view so we see summary values for each high-level category of increases and decreases. In Personal Accountz, separate accounts are established for each level of detail (category and sub-categories) down to the lowest level and there is a powerful concept of grouped accounts which can bring together totals for the subordinate accounts of a particular group, including lower-level groups of accounts.
In fact using Personal Accountz in conjunction with this new domestic accounting model means that your Balance Sheet and Changes report is as up-to-date as the last transaction entered!
Ignoring any differences in values in the three columns, this first raw report view above includes in the upper half, the DBS values for the assets of £637,300; the liabilities of £123,000; and the estimated/consolidated domestic wealth of £514,200 being the previous domestic wealth of £488,300 plus the Total Domestic Changes of £25,900 appearing further down.
In the lower half, you can see the DWBS amounts for the Basic, Discretionary and Other increases and decreases. The little + signs next to each heading indicate that there is more detail that can be exposed or drilled-down by clicking on one of the + signs when looking at the report on a computer screen.
In the next view, below, you can see different levels of the expansion of a number of entries for various Basic increases and decreases. As before, new + signs appear indicating that there is more detail at further, lower level sub-categories that are available to be examined from the screen, if needed:

Below, you can see more dynamic detail after different + signs have been clicked.
What is important to note is that the values are the same as those summarised in the formatted version of the report produced from a different accounting software package. In the next two examples, you will see a different type of layout, still from Personal Accountz .

Here, the results for two particular queries, all of the Domestic Decreases (above) and just the Basic Decreases (below) include all the individual transactions contributing to each group of decreases, together with a breakdown of their sub-totals, by month. In these screen shots we can only see the last few of the transactions before the monthly summaries are displayed but on the screen, all the individual transactions can examined on-line by use of the vertical sliders.

It is useful here to look for significant, out of the norm, changes in values over the months and where they are noted, further examination of the transactions will lead to the reasons which may well have valid explanations. Alternatively, these may represent the first signs of some excessive decreases that might be the target for some action to achieve a better balance.
In the next example, we have a display of the monthly totals of a sub-category of the Basic decreases, for Personal Transport:

A quick glance shows an uncharacteristically high value for May which we can quickly be reminded by looking into the transactions was due to some rather expensive repairs that took place in that month.
Now I want to show you a raw report of similar data from another software package, Microsoft Money©.
The first report shows the section for the decreases sorted here in reverse alphabetic order, by categories. If you were to cross check, you would note that the values are the same as those produced with the other software accounting package (Personal Accountz). The differences are that Microsoft Money uses pre-set category indexes which are flagged in the transactions to provide associations to the appropriate DWB categories and sub-categories. With this, we can distinguish between the elements of the DWB structure by queries related to category indexes, in contrast to Personal Accountz which uses individual accounts for each of these category and sub-category elements of the DWB structure.

The next report shows a formatted portion of the DWBS extracted from Microsoft Money. This time, you see a spreadsheet version of the Basic increases and decreases; this shows the layout in Microsoft Excel from which the printed version was obtained which you saw in three sections in the second example report, further above. The data for this report was transferred with a couple of key-clicks, from the Microsoft Money report by sub-categories immediately above (you can see the option ‘Export to Microsoft Excel’ in the left margin of the screen image). Some editing was done based on a pre-stored spreadsheet report layout which is used over and over again for the DWBS reports.

Another aspect or variant of reporting is graphic summaries. These will be examined in a later blog and so I will conclude here by remarking that we have only just touched upon some of the sorts of information that can be obtained from these reports as a basis for decision-making.
Decision-making is at the core of financial management, including planning and control and I will devote considerable attention to this in later blogs.
For those becoming interested and impatient to see more blogs in this series, I also have more information about DWB Accounting and my book 'Accounting for a Better Life' at my web site Domestic Well-Being (DWB) Accounting !
copyright © 2006 John M Passmore

No comments:
Post a Comment